Project Planning and Management Tools in International Projects: Chapter 2. Gantt chart as a tool for project management
Chapter 2. Gantt chart as a tool for project management
This blog is written as a part of Nutshell project (2020-2023). The aim of the project is to improve and develop processes and tools for higher education institutions (HEIs), when applying for, and managing international EU or global projects. Through the project, the partners benchmark and evaluate differences in project planning and management processes. The tools developed within the project will be available for other HEIs on an international level. The project partners are University of Economics, Prague; University Ljubljana; CESIE – European centre of studies and initiatives, Italy and Humak – University of applied Sciences, Finland. This blog is one of three blogs produced during the project by Humak. First blog here.
In this blog I shall focus on a tool for the implementation stage of a project, Gantt chart. Gantt chart is a good help for scheduling and managing project activities. It is a way to visualize the project tasks, milestones and deliverables in a chart. The chart is meant to be a tool for following-up on the project and evaluating the project situation. (Nutshell 2022.)
Work packages
In a project, especially EU or other large projects, the first phase of project planning is to share the project into work packages. In practice work packages are the project broken down into different parts. (European commission 2023.) Work packages consist of different sets of activities that have certain aims, tasks and outputs. Each work package has a partner and a team responsible for working on the tasks towards the aims. Work packages are sub-projects within the project.
The tasks or activities of a project should be broken down into smaller parts that are understandable for the project partners and staff supporting them when realizing the project.
Milestones
The second phase would be to share the different work packages into milestones that are phases in the project that need to be achieved. For example, three milestones for the work package may be building a training plan, marketing the training in networks, realization and evaluation of the training, each of these during a certain period of time. This is the actual procedure of the work package. Different activities or tasks may be attached to for example resources, time or logical procedure (Ruuska 2012). It is important that the planning of these different work packages and milestones work hand in hand.
Deliverables
The third part consists of thinking of the deliverables of these work packages and milestones. The outputs are the products of the project activities, certain kind of evidence of the project realization. A deliverable is the output offered the target groups for further use. A deliverable could be for example a service, a guide book or a web portal.
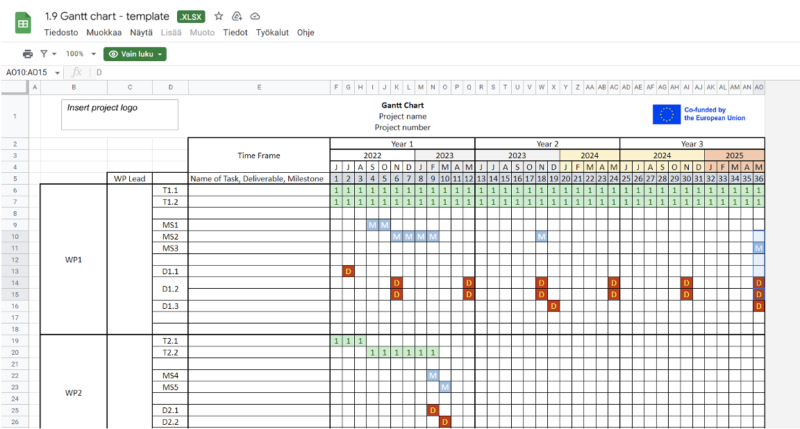
After having thoroughly planned the work packages, tasks, milestones and deliverables they can be visualized in a chart form, for example a Gantt chart. A Gantt chart shows at a glance how the project should proceed and how the different parts are connected in a time frame. Details can be further described in the project plan. (See Chart 1.)
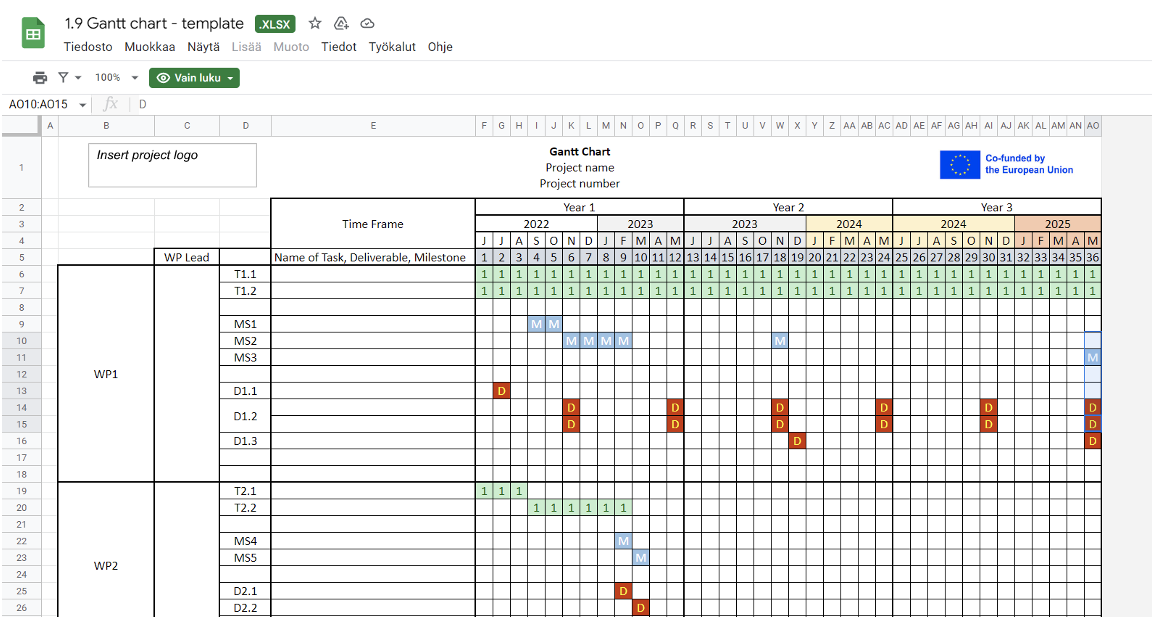 Chart 1. Gantt chart template (Nutshell 2022).
The challenges with a Gantt chart
The challenge with the Gantt chart may be that projects are not always so linear as the chart indicates. For example, it may be too restrictive to build a chart when the development is rather spiral, where different methods are used and tried out, developed further or noticed not to be useful and therefore discarded. In these kinds of projects, the chart needs to be reinvented so often that it does not necessarily help project management (Ramos 2021).
A Gantt chart is not an applicable tool if the above mentioned work packages, milestones and resources are not thoroughly planned and estimated and divided into small and understandable units of activities. If the timeline in the chart is too long and the deliverables too abstract it may be difficult to realize. (Ruuska 2012, 205-209.) This means that planning a chart should be a part of project planning and the division of the work packages, tasks, milestones and deliverables.
Conclusion
The Gantt chart communicates work packages, milestones and deliverables and helps the project team and other cooperators to understand and manage their work and resources on a time frame. The chart gives an overview of overlaps and dependencies. It is a tool that offers a visual overview and helps managing the project as a whole.
Baana project’s example of project work packages
Baana project supported migrant employment and gave employee support to companies in Southwest Finland during three years 2016-2019. In this project there was a work package aiming at training migrant background unemployed people on entrepreneurship in Southwest Finland. The task was to develop and carry out a training programme for this target group. The aim for this task was that a certain amount of people with migrant background have taken part in a training programme and learned entrepreneurship skills. One work package was the evaluation of the migrant entrepreneurship training, and the responsible partner wsa Humak university of applied sciences. If the training is not successfully realized on time, it will also have an effect on the evaluation of the training, meaning there was a connection between the work packages, project actors and milestones of these two sets of activities, i.e. work packages. In the end the deliverable of the described work package was a training guide for instructors based on and developed through evaluation and practice.
Sources
European Commission 2023. Managing projects. Fact sheet 3: Planning of Content Work Packages. Seen 13.2.2023. https://ec.europa.eu/chafea/health/beneficiaries-corner/documents/factsheet-03.pdf
Nutshell 2023. The Nutshell Project Management Toolkit for Higher Education Institutions. Seen 19.5.2023. https://cesie.org/en/resources/project-nutshell-toolkit/
Ramos, Diana 2021. The Advantages and Limitations of Gantt Charts in Project Management. Smartsheet Inc. 5/2021. Seen 13.2.2023. https://www.smartsheet.com/content/gantt-chart-pros-cons
Ruuska, Kai 2012. Pidä projekti hallinnassa: Suunnittelu, menetelmät, vuorovaikutus. 7th edition. Helsinki: Talentum.
Publications (Articles, Blogs & Podcast)
- Article

- Creative Field Entrepreneurship
The Window to India Is Open: Why Focused Strategy Defines the Next Breakthrough in the World’s Fastest-Growing Music Ecosystem
- Article

- Research and Development
- Resilient Societies
Crises as Catalysts for Change: The Foundations of the Resilient Societies Research Programme
- Web publication

- NGO Work
Ever Wanted to Be an Explorer? – Tikkala Schoolchildren Learning at the Struve Geodetic Arc at Oravivuori Station Point
- Web publication